Up & Down Emotions
The last week of November cleans up the overbought of the last few weeks. The examinations begin to understand the solidity of the recent increases.
Final hours for a week characterized by contrasting emotions. After another perky start that in three days brought the prices of Bitcoin back to a step from the historical records of December 2017 - area $19,800 - accompanied by record volumes, the climb began to show dizziness. Affected by news from the United States (see news section below) that would cause owners of non-custodial wallets to fear the end of their privacy, the pretext of taking advantage of the large profits accumulated in a few weeks triggered sales, causing in less than 48 hours the deepest drop (-17%) since the beginning of September, when in just under a week, from September 2nd to 8th, the fall came close to -20%.
From the minimum of Thursday, November, 26th - area $16,220 - the purchases that in these hours bring the price of Bitcoin back to one step from $18,000. Contrary to the other weeks marked by an almost solo bullish Bitcoin race, as already highlighted in the previous report the bullish momentum passed the baton to the Altcoins that at the beginning of the week brought the quotations back to levels that had not been recorded for over two years. Ethereum, the queen of the Altcoins, is back above 620 USD for the first time since June 2018.
Ripple XRP, the third-largest in terms of capitalization, in five days went from 28 to 78 cents. A gain of over 170%, for XRP the fastest increase since September 2018. For the Altcoins the decline was more aggressive with falls of over 20% for Ethereum and over 35% for Ripple XRP. Despite the roller coaster, the medium-long term trend remains well established. There are only a few hours left until the end of November which, unless disastrous events occur and if this weekend's prices are confirmed, it would be the best monthly closure ever for Bitcoin, while for Ethereum it would be the highest closure since May 2018.
With the exception of 2017, in the last few years December has often been characterized by a two-sided trend and, even if not particularly sharp, this month marked a turning point for prices in the first months of the following year. The coming weeks of December will be important to confirm the maturity of the rise built up in the last three quarters.
DeFi - Decentralized Finance
This is it, it's official: the Eth2 phase, known as Ethereum 2.0, will be activated on December 1st, 2020.
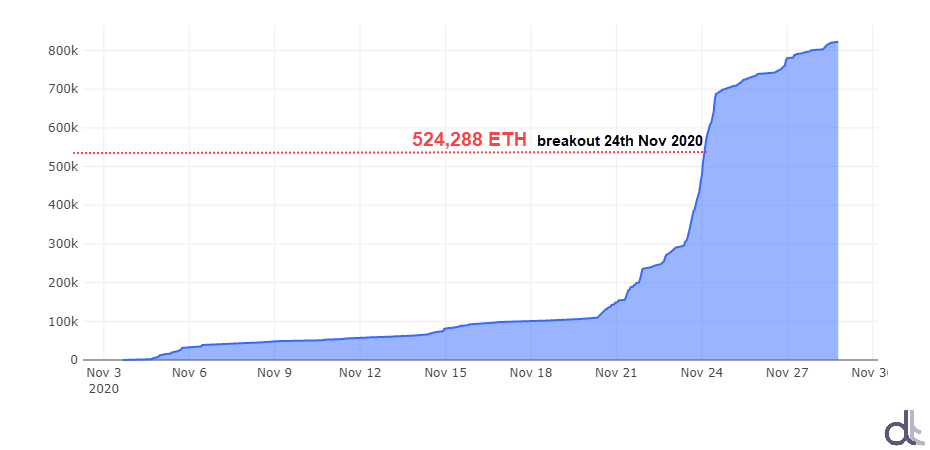
The deposit contract exceeded 822,000 ETH - the required threshold had been set at 524,288 ETH - to which interested users had to transfer their ETH in order to participate in the staking, binding their use for a period of time.
ETH 2.0 Staking
In a few hours a key element of the "beacon chain" will lead to the transformation of mining from proof-of-work to proof-of-stake in the future.
The shift is already impacting both on the price of Ethereum, which in recent days has recorded the most intense increase in value in the last quarter, and on the liquidation of ETH previously locked in decentralized finance protocols. This has had a significant impact on what happened in the last week. In fact, despite a considerable appreciation in the prices of Ethereum, which accounts for more than 80% of the collateral used, the total capitalization of the value locked (TVL) in DeFi protocols has not recorded any growth. On the contrary, during the bearish phase in the second half of the week, TVL dropped to $12.8 billion, the lowest level in the last 20 days.
Total Value Locked in DeFi
The total trading volume on decentralized platforms has risen to over $5 billion. An increase of 16% on a weekly basis, while on a monthly basis with about $16 billion traded there has been a decrease of about 10% since October.
DEXes Volume Last 7 Days
Uniswap remains the leading DEX with over $2.8 billion in volume over the last seven days, maintaining 56% of the entire decentralized trading market.
SushiSwap, the vampire protocol of Uniswap itself, climbs to second place, with over $750 million rising to 15% of market share, to the detriment of
Curve, which is falling with the same intensity to 10.4% while maintaining the same amount of trading as last week.
5 Hottest DeFi News of the week
Idle Finance launches its governance program
Compound liquidator makes 4 M as oracles post inflated DAI price
Aave launches Aavegotchi with Everipedia
Technical Analysis
Bitcoin (BTC)
Bitcoin prices are entering the most critical phase of the current quarterly cycle that started between September and October. If confirmed the structure that has characterized the regularity of the previous cycles since the beginning of 2019, in this period prices are close to the ending of the first sub-cycle of the quarterly foreseen in these days (1).
The recent fall is proving useful to absorb the strong overbought that had formed in the last two weeks and begin to evaluate support levels where it is possible to rebuild the basis for a return of purchases. In these hours the current return of prices above 18,000 USD is to be configured as a technical rebound. An overcoming of the 18.250 USD (2), a level being tested in these hours, would begin to convert the signal from technical rebound to return of the force that would materialize only with the overcoming of the 18.800 USD (3).
If this were to happen, it would be better if it did within the next few days of the week and not with a vertical structure. On the contrary, a return under 16,800 USD (4) in the next few days will indicate that it is still in the sub-cycle closure phase (60-90 days) indicated above.
BTC Chart
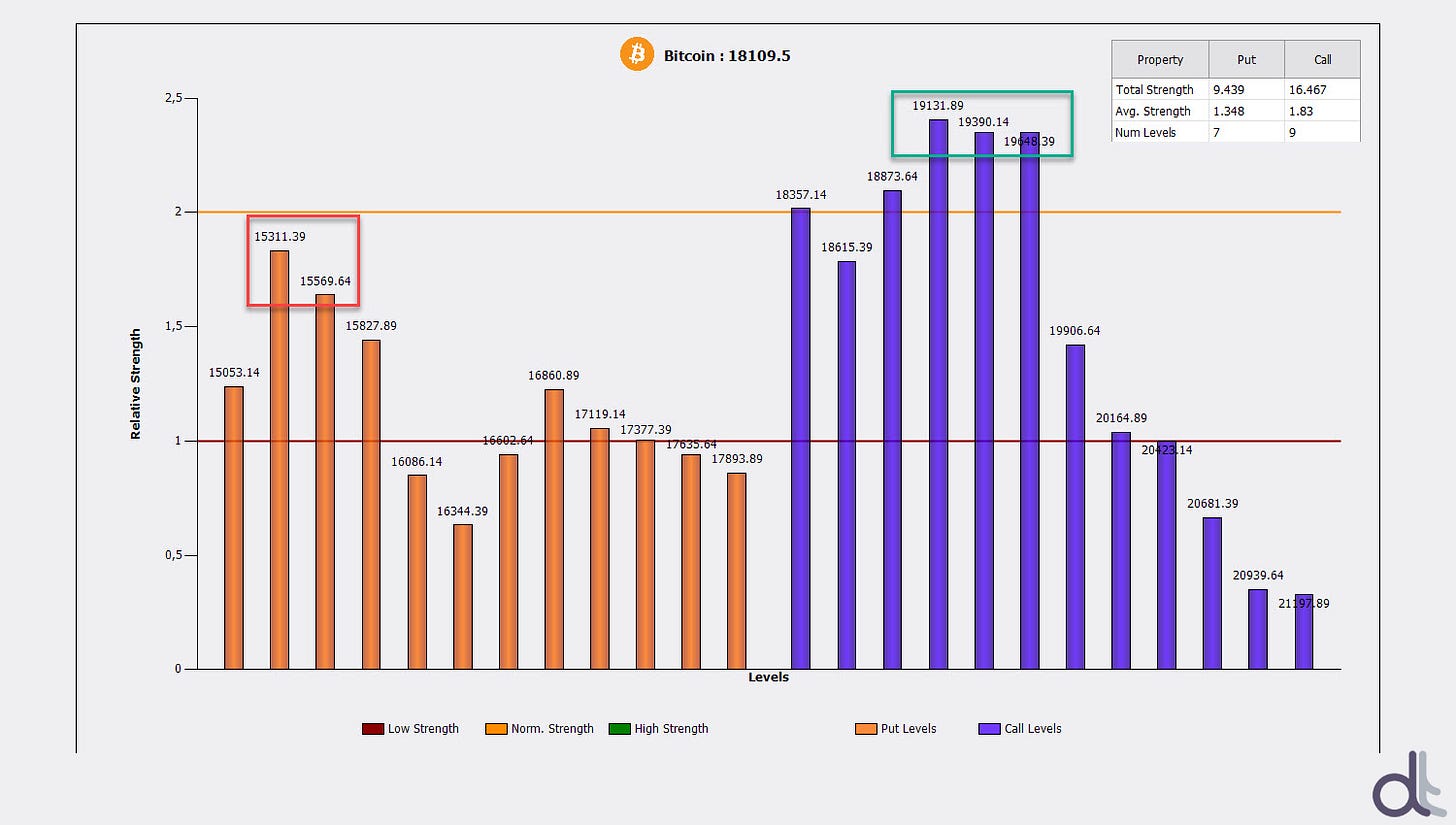
Options traders are starting to reinforce the hedging strategies that have been in place since last week. Call option hedges (upwards) are increasing to protect above the recent highs. In case of increases, barriers between 19,130 and 19,650 need to be broken. On the other hand, the first protective barrier is placed between 15,550 and 15,300, just below Thursday's lows.
BTC Options
Ethereum (ETH)
The decline that started from Tuesday's high in area 620 USD (1) and ended Thursday in area 480 USD (2) confirmed that the previous resistance (3) has now become support (2). A price recovery has been underway for the past three days, which in these hours has brought prices back to 550 USD. A rebound that at the moment finds a lower intensity than Bitcoin but that analyzed in a medium-long term perspective, is part of a more defined technical structure and with more defined technical areas of maneuver.
ETH Chart
For Ethereum the cyclical times are very similar to those of Bitcoin, therefore in this temporal phase it is useful to understand if the recent decrease is the conclusion of the direct monthly sub-cycle (hypothesis between 30 and 45 days) or the prices have already entered in the new monthly cycle of the same duration. It is necessary to wait for the next days of the week to have a technical and cyclical picture with more details. To follow the updates you can do so by subscribing to the Telegram channel by clicking here.
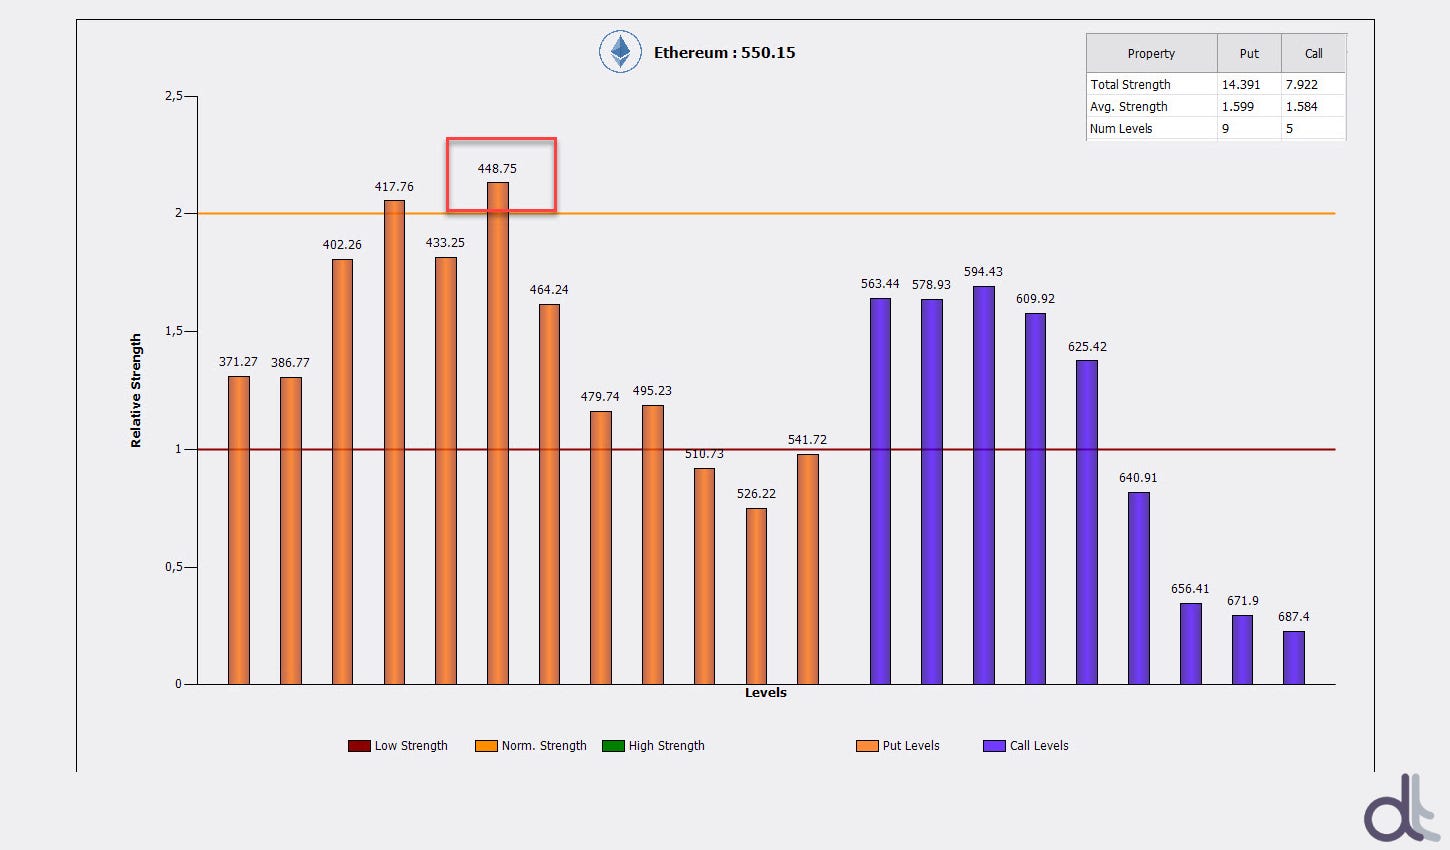
The operators in options continue to remain set upwards by keeping the coverage in Put options high (downwards). Warning signals only with falls below 450 USD.


